
Dashboard
The home screen draws your energy as it moves right now — from the sun, into the battery, out to the house, to and from the grid.
The dashboard is two pages. The first is the diagram; swipe up for your charts. Pull down anywhere to refresh.
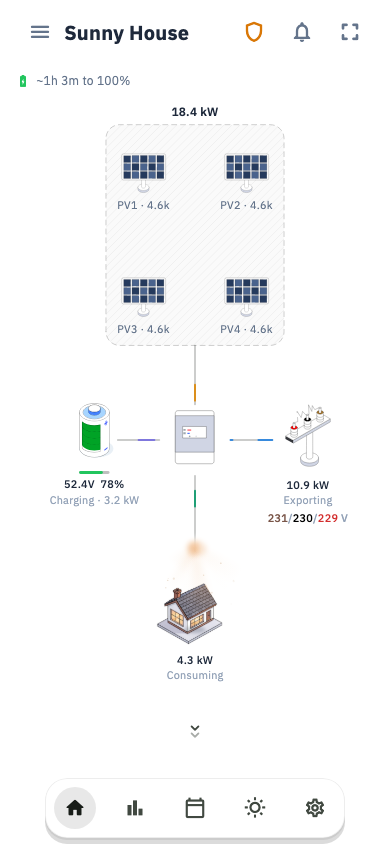
The energy diagram
Four things surround your house, and lines connect them. Power travels along each line as a moving pulse, so you can see direction at a glance.
- Sun — what the panels are making right now.
- Battery — how full it is, and whether it is charging or draining.
- Grid — power coming in, or going out. Negative means you are exporting.
- House — what your home is using.
Reading it in one second
Pulses flowing toward the house mean something is feeding you. Pulses flowing away from the house, toward the grid, mean you are selling.
Tap any of the four to open a detail card with more context — including what today's grid import and export have actually cost or earned on your tariff.
The cards below
- Battery — charge level, power in or out, and how long it will last. The countdown stops at your inverter's own cut-off level, not at 0%, because that is when your house actually goes dark.
- Grid — voltage, import and export, priced for today.
- Solar — per-string output. Four or more strings fold into a compact grid.
- Generator port — only if your inverter has one in use. See Smart load and generator port.
On your home screen, outside the app
Svitgrid has a home-screen widget for Android and iOS showing live power without opening the app. The Android widget also has a refresh button.
Banners
Short messages above the diagram, each appearing only when it applies: firmware updating, data looks stale, battery not configured, a scheduled blackout is coming, solar is being curtailed because the battery is full and there is nowhere for the power to go.
Homes with several inverters
Svitgrid draws a diagram that fits however many inverters you have, and the totals are summed from exactly the inverters shown. A filter bar at the top lets you look at one inverter at a time, and a table view compares them side by side.
If two inverters share one physical battery bank, say so in Inverter settings — otherwise the same battery is counted twice.
How often it updates
New readings arrive as fast as your collector sends them, and that rate is a setting rather than a fixed speed. Look for Cloud reporting — "how often this system reports to the cloud" — on your collector's own screen: Harvest for a phone, Edge device for a Gateway, or Home Assistant. You can set anywhere from 30 seconds to 5 minutes.
The fastest step you may choose depends on your plan: 30 seconds on Plus and Pro, 60 seconds on Basic. A longer interval is gentler on a phone's battery and on your data allowance.
If the dashboard feels slow, check this setting before assuming a fault
A 5-minute interval is a perfectly healthy system reporting exactly as configured.
Data can only be as fresh as your collector
If your phone is the collector, the dashboard is live only while you are home with the app open. Away from home it shows the last reading collected, with a "stale data" banner. This is not a fault — see How Svitgrid works.