
How Svitgrid works
Something on your home network reads your inverter and sends the numbers to Svitgrid. You choose what that something is: your phone, a small Svitgrid box, or Home Assistant.
Your inverter is not on the internet. It sits on your home Wi‑Fi and answers questions from anything on the same network.
So Svitgrid needs a collector — something at home that asks the inverter for numbers and forwards them to the Svitgrid cloud. Your phone then reads them from the cloud, wherever you are.
  inverter  ──►  collector  ──►  Svitgrid cloud  ──►  your phone
 (your home)   (your home)         (internet)         (anywhere)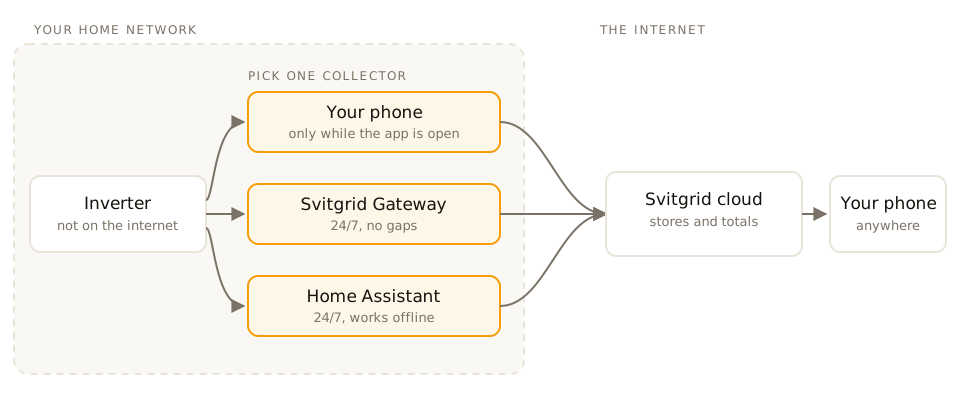
Everything else in Svitgrid — charts, money, forecasts, schedules — is built on that one flow. Which collector you pick decides how complete your data is.
The three collectors
| Your phone | Svitgrid Gateway | Home Assistant | |
|---|---|---|---|
| Cost | Free | 999 ₴ once | Free, if you already run HA |
| Collects when you are out | No | Yes | Yes |
| Collects at night | Only if the app is open | Yes | Yes |
| Typical coverage | 2–4 hours a day | 24/7 | 24/7 |
| Control the inverter | Yes, at home only | Yes | Yes |
| Zigbee sockets, EV charger | No | Yes | No |
| Read a battery BMS | Yes, while the screen is on | Yes, always | No |
| Works with no internet | No | No | Yes (local mode) |
Which should I choose?
If you own a Svitgrid Gateway, use it — it is the only option that never has gaps. If you already run Home Assistant, use that. Your phone is a fine way to start, but it can only see your system while you are standing in the house with the app open, so your charts will have holes in them. See Data quality.
Why gaps matter
A collector that only runs sometimes does not just lose those hours — it quietly ruins the numbers built on them. Your daily total is short, your solar forecast learns from an incomplete picture, and a scheduled event cannot run if nothing is at home to run it.
What happens in the cloud
The cloud stores your readings, adds up daily and monthly totals, prices them against your tariff, runs the forecast, and decides when a scheduled event should fire. It also sends your notifications.
More detail — how long data is kept
| What | Kept for |
|---|---|
| The live reading | Always current, overwritten each time |
| 5‑minute detail | 7 days |
| Hourly detail | 90 days |
| Daily, weekly and monthly totals | Forever |
So a chart of last week is built from 5‑minute data, a chart of last month from hourly data, and a chart of 2024 from daily totals. Zooming into a single day two years ago will show the day's total, not its minute-by-minute shape.