
Data quality
Every chart, total and forecast is only as good as the hours your collector was actually running. This page explains how to tell whether yours has gaps.
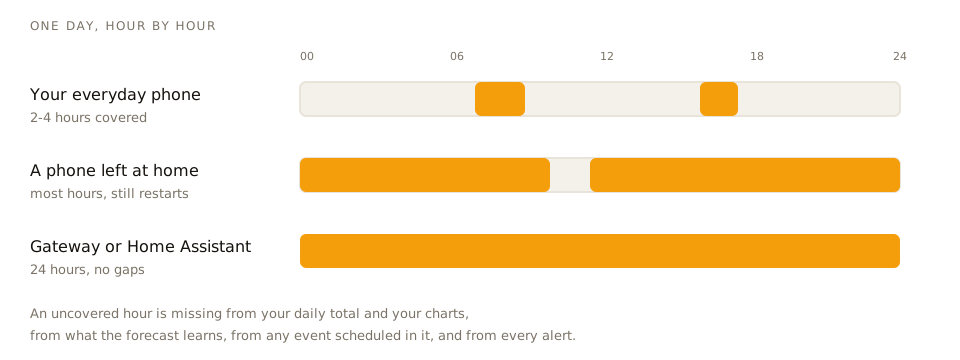
The problem with collecting on a phone
A phone is not a server. It sleeps, it leaves the house, its battery runs down, the operating system closes background apps to save power. A phone collector typically covers 2 to 4 hours a day.
That does not merely lose those hours — it distorts what is built on them:
- Daily totals read low. Energy that flowed while nothing was watching is not counted.
- Charts have holes. Svitgrid draws a gap rather than inventing a line, so you can see it.
- The forecast learns from an incomplete picture and takes longer to become accurate.
- Scheduled events do not run. If nothing is at home at 02:00, nothing tells the inverter to charge.
- Alerts do not fire. "Inverter offline" cannot be detected by a collector that is itself offline.
Your options, best first
1. A Svitgrid Gateway. 999 ₴, collects 24/7, runs your schedule, reaches Zigbee devices and battery monitors. This is the option with no gaps.
2. Home Assistant. Free if you already run it, collects 24/7, can control the inverter and run schedules locally.
3. A dedicated phone left at home. Free if you have an old phone. Plug it in, join the home Wi‑Fi, open Svitgrid, allow the screen to stay awake, and disable battery optimisation for the app. Better than nothing, worse than either option above — phones still restart for updates and drop off Wi‑Fi.
4. Your everyday phone. Fine for trying Svitgrid out. Not a monitoring solution.
Checking your own data
Open Charts → Overview and look at the production heatmap. Collected hours and genuinely-zero hours are drawn differently, so gaps are visible as gaps.
The dashboard also has a Data collection health card on phone-collector households, which states plainly how much of the last day was actually covered.